Companies need revenue, and the more the better—just like the inflow of water into the main pipe in a building. Revenue is generated by selling your company’s products and services. This revenue generation is influenced by investing in three Cs (representing the control of the lever and attached block that allows water to flow into the main pipe):
- Coverage: refers to the ability of the company’s products to address as many segments, shelves, and geographies of the available market as practical.
- Competitiveness: refers to having compelling products in each segment, shelf, and geography that can take market share.
- Conversion: refers to the ability of the sales team and partners to sell the company’s products through the various channels to maximize revenue.
All addressable markets can be divided into two dimensions: geographies and segments. A geography is a defined area where you sell your product. Segments represent how you have mapped your products to customer preferences or categories.
It is impractical to have one product that everyone will like or want. So, companies divide their products into categories based on user preferences or buying choices. Each of these categories is a segment. The company may further divide the segment into sub-segments. A sub-segment may be a sub-category such as a price shelf—a price range at which a product competes with similarly priced products.
The total available market, also known as the total addressable market, is the total of all products sold in every geography across every segment and sub-segment. The potential share that a product can take in a geography, segment, or sub-segment is dependent on its competitiveness and the effectiveness of your sales channels and sales team.
Consider laptop sales as an example. Laptops are sold to consumers and businesses. Within the consumer segment, there are sub-segments such as enthusiast laptops (high performance), mainstream laptops, fanless laptops, and opening-price-point (or entry) laptops. Each sub-segment may have one or more price shelves.
Similarly, the business segment comprises two sub-segments: enterprises and small and medium business (SMB). Each of these sub-segments have different price shelves, depending on the specifications and capabilities of laptops sold into these sub-segments.
To visualize your business revenue and growth potential, create a map of every geography, segment, and sub-segment where you are selling your product.
Next, assess how your products are doing in these geographies, segments, and sub-segments relative to the three Cs (coverage, competitiveness, and conversion). The results should diagnose your current revenue and highlight gaps to be addressed for revenue growth.
Let us consider a very simple example shown in Table 1 below. Our company sells its product in only one geography, the U.S.. The market comprises two segments, namely businesses and consumers. Each of these segments is further broken into two sub-segments, as shown in Table 1.
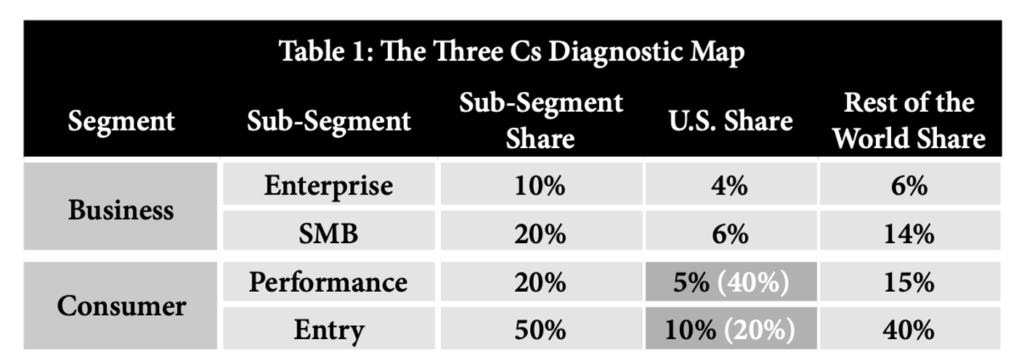
The percentage sales of products in each sub-segment relative to the total addressable market (100 percent) are shown in Table 1 as sub-segment share.
For example, the enterprise sub-segment is 10 percent of the total addressable market, and the entry sub-segment is 50 percent of the total addressable market.
The next two columns in Table 1 show the percentage sales within each sub-segment in the U.S. and the rest of the world. The dark-gray shaded region represents where our company sells its products—restricted to the consumer segment in the U.S.
We begin our diagnosis by entering the adoption rate of our company’s product in those cells in Table 1 where we sell our products.
Let the white numerals in each cell in Table 1 represent the adoption rate for our company’s product. Our company’s product has an adoption rate of 40 percent in the performance sub-segment in the U.S. This means customers buy our company’s product 40 percent of the time in that market. This generates a share of 2 percent (5 percent U.S. share times 40 percent adoption rate) in the performance sub-segment out of an available 20 percent.
If we repeat this calculation for the entry segment, where our company also sells products, it gives us a potential share of 2 percent (10 percent U.S. share times 20 percent adoption rate) of the entry sub-seg- ment out of an available 50 percent. Adding up all our share numbers, we arrive at a measly share of 4 percent of the total addressable market (100 percent).
There are several observations one can make from this simple diagnosis.
We could grow our company’s market share with the following options (increasing coverage):
- Expand sales in the U.S. for the consumer segment because we have only 4 percent out of an available 15 percent.
- Introduce new products that can be sold in the U.S. to the business segment, which is 10 percent of the market.
- Expand sales of our products to the rest of the world, which represents 75 percent of the market.
Next, our company needs to determine which option it should pick, build the right products, and market and sell these products to capture market share and grow its revenue.
Another observation from Table 1 is that our company has a 40 percent adoption rate in the performance segment in the U.S. but only half this adoption rate (20 percent) in the entry segment.
A likely reason for this difference in adoption rate is that our company’s products in the performance sub-segment are strong, but in the entry sub-segment they are weaker than competitors’ products. This points to weaker competitiveness that should be analyzed and addressed. It could also mean the sales channels selling these cheaper entry sub-segment products are not as effective (conversion issue).
Such a diagnosis, while overly simplified, can help you drill down into each of the potential issues inhibiting share gain in the three Cs, highlighting what you must do to improve your revenue.
In subsequent chapters, I will explain how to create a methodical process with actions to systematically close the gaps via strategy, product creation, sales channels, and execution. During this investigative phase, you are uncovering the core issues to be fixed to improve cash flow, not seeking to implement changes or corrections.

Excerpted from “Your Company Is Your Castle: Proven Methods for Building a Resilient Business” by business transformation veteran Sandeep Chennakeshu:
Bio: As former CTO of Eriscsson and President of Blackberry, Sandeep Chennakeshu has spent thirty-four years in three industries whose products have transformed all our lives. He was privileged to lead teams across fourteen countries that pioneered products in wireless (2G, 3G, 4G mobile phones, Bluetooth, Mobile-Satellite systems), semiconductors for consumer, automotive and medical electronics and mission-critical software for cars, medical equipment, nuclear power plants, high speed rail and industrial robots. Along the way he transformed businesses to grow profitably in a sustained manner using the principles outlined in his new book “Your Company Is Your Castle.”